HRV Poincare Plot
This page is the first in our exploration of Heart Variability (HRV) and methods of HRV study using the Pulse Sensor. First up: Phase Space!
We met Steven Dean at a gathering of the NYC Quantified Self Meetup back in the early days of Pulse Sensor. One of the first things that he ever asked us was "Can you measure HRV with it?". Our immediate answer was "Yes, of course!". Well, we've had a few revisions of hardware and software since then, and the answer is still 'yes'. This page describes a few first stabs at measuring HRV, or Hear Rate Variability. HRV refers to the natural variation in the time between each heartbeat, also known as the Inter-beat Interval, or IBI. Most of us are used to thinking that our hearts beat at a fairly regular and predictable rate, and we refer to this as Beats Per Minute (BPM). But BPM is really measured as an average of some beats over time. Nobody's heart clocks in at a truly steady and regular rhythm (Unless you have a pacemaker, in which case your beat better be really super regular!). BPM is derived as an average of IBI values, but IBI values naturally fluctuate all the time. HRV studies track those fluctuations.
Factors that cause change in IBI could be the sympathetic or parasympathetic nervous system, respiration, psycological or medical condition. There are some clinical uses for HRV studies, and there are some areas that need more research (see the wikiThing and the world wide web for more). It is not our goal to make the case for efficacy or usefulness of HRV studies, merely to provide a few working examples of how to do it. The method of HRV analysis covered on this page will employ a Poincare Plot of the IBI values.
A Poincare Plot is a geometric representation of a time series (n1, n2, n3, n4....nX) and graphs the current data point against the previous data point in a cartesian coordinate system. The progression of points goes (x=n2, y=n1) and then (x=n3, y=n2), etc. in Poincare plotting, the x-axis is labeled 'n' and represents the most recent, or current data, and the y-axis is labeled 'n-1', which represents the data value that came just before n. the end result (no pun intended) is a point cloud that reveals the symmetry of your IBI values over time. If you focus your breath to be slow and calm, your point cloud should have a nice oval shape. If your shape is not oval, or not nice, you may be a zombie. You might want to get that checked...
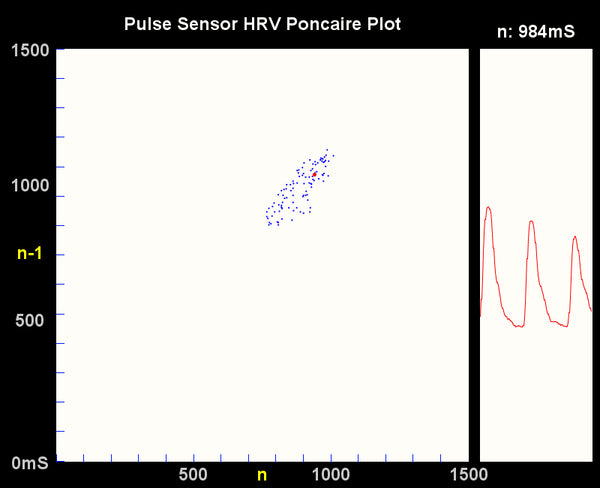
Here's an example screen grab from the processing sketch PulseSensorAmped_HRV_Repository.This program should be used with an Arduino running the latest PulseSensor Arduino code. Follow the tutorial HERE to set up your Arduino to read the Pulse Sensor Signal and output data to this sketch.

The program places a red dot when new IBI data is sent from Arduino. The previous data points (up to 100) in the time series are drawn in blue. On the right is a thin data window that displays Pulse Sensor raw data, so you can verify the pulse wave and debug your Pulse Sensor easily. The most recent IBI value sent from Arduino is printed in the upper right corner as the current n value. The code has some nice keyboard command features built in.
- If you press 'S' or 's', you will save a .jpg image of the program window for posterity in the sketch folder
- If you press 'R' or 'r', you will clear the Poincare Plot window (kinda like shaking an etch-a-sketch)
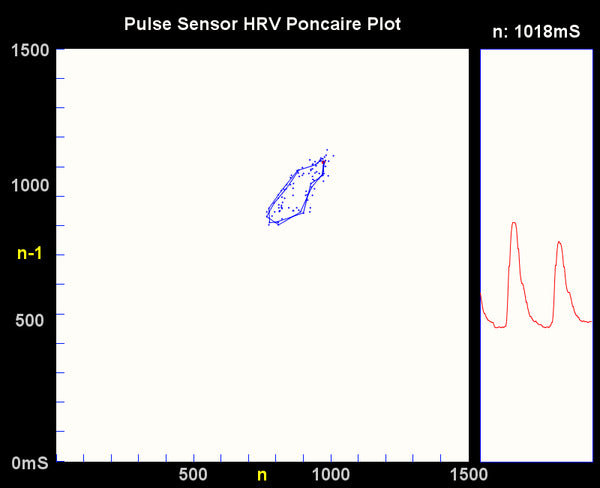
- And if you press 'L' or 'l', the program will trace the last 20 plot points.
Here's what the plot looks like when you press 'L' or 'l'. The more oval shaped line you have, the more sinusoidal is your heart beat rhythm. I focused on slow, deep breathing to get this nice oval shape.

The nice thing about sharing this program as a Processing sketch is that now you have the ability to change stuff around. This HRV visualizer is intentionally minimalist. Want to see a longer trace of the plot points? Go for it! Don't like the color of the pulse waveform? Change it up! You will find the code generously commented and Processing has lots of hand-holds for beginners and experts who want to dive in and move/add a few things.
HRV Poincare Plot analysis is way beyond the scope of this page, and anyway, there's tons of info widely available on the Internets. We do, however, want to make sure that you have reliable IBI data to start with, and do our best to design the Arduino code so that it accurately finds the instantaneous moment of the heart beat. For details on how the Arduino code does this, check out the Technical Walkthrough page.
There's more than one way to graph IBI data for HRV research! Check out our Time Domain and the Frequency Domain pages to visualize the changing rhythm of your heart beat.
